Tanusri Gururaj, Academic content writer of Physics at Edumarz
Distance-time graph:
-
Distance is along the y-axis and, time is along the x-axis.
-
A distance-time graph is used to calculate the speed of the object. The slope of the graph gives the speed.
-
The distance-time graph for an object moving at uniform speed is shown below-
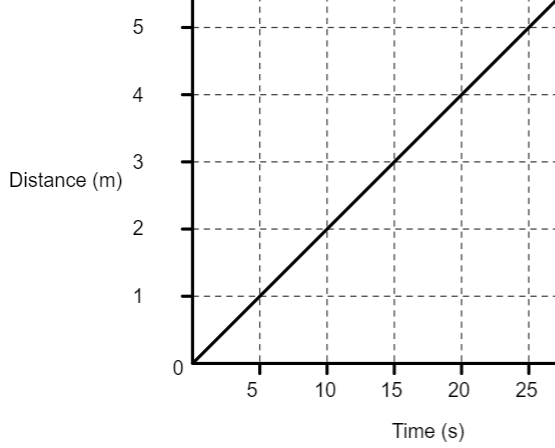
To calculate speed from the above graph, take two points A and, B on the line. Let us assume that point A is (10, 2) and point B is (25, 5).
Since the slope of the graph gives the speed,
Slope = speed = vertical difference/horizontal difference.
Speed = ((5-2)/(25 – 10)) m/s
Speed = 3/15 = 1/5 = 0.2 m/s
Similarly, we can calculate the velocity of an object if it is a displacement-time graph where displacement is along the y-axis and, time is along the x-axis.
Velocity-time graph:
-
Velocity is along the y-axis and, time is along the x-axis.
-
The area under the velocity-time graph represents the displacement as,
Displacement = Velocity x Time
-
The slope of this graph gives the acceleration as acceleration is the rate of change of velocity.
-
If the graph is parallel to the time axis it means that the velocity of the body is constant and, hence, the acceleration will be zero.
-
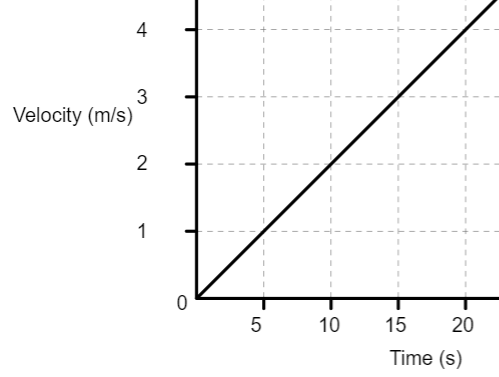
The Velocity-time graph for an object moving with uniform acceleration is shown below.
-
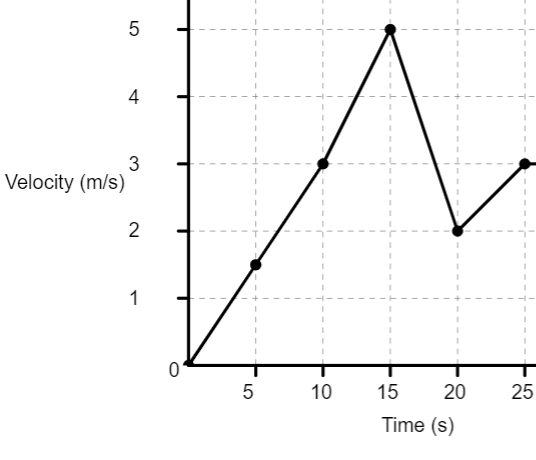
The Velocity-time graph for an object moving with non-uniform acceleration is shown below.